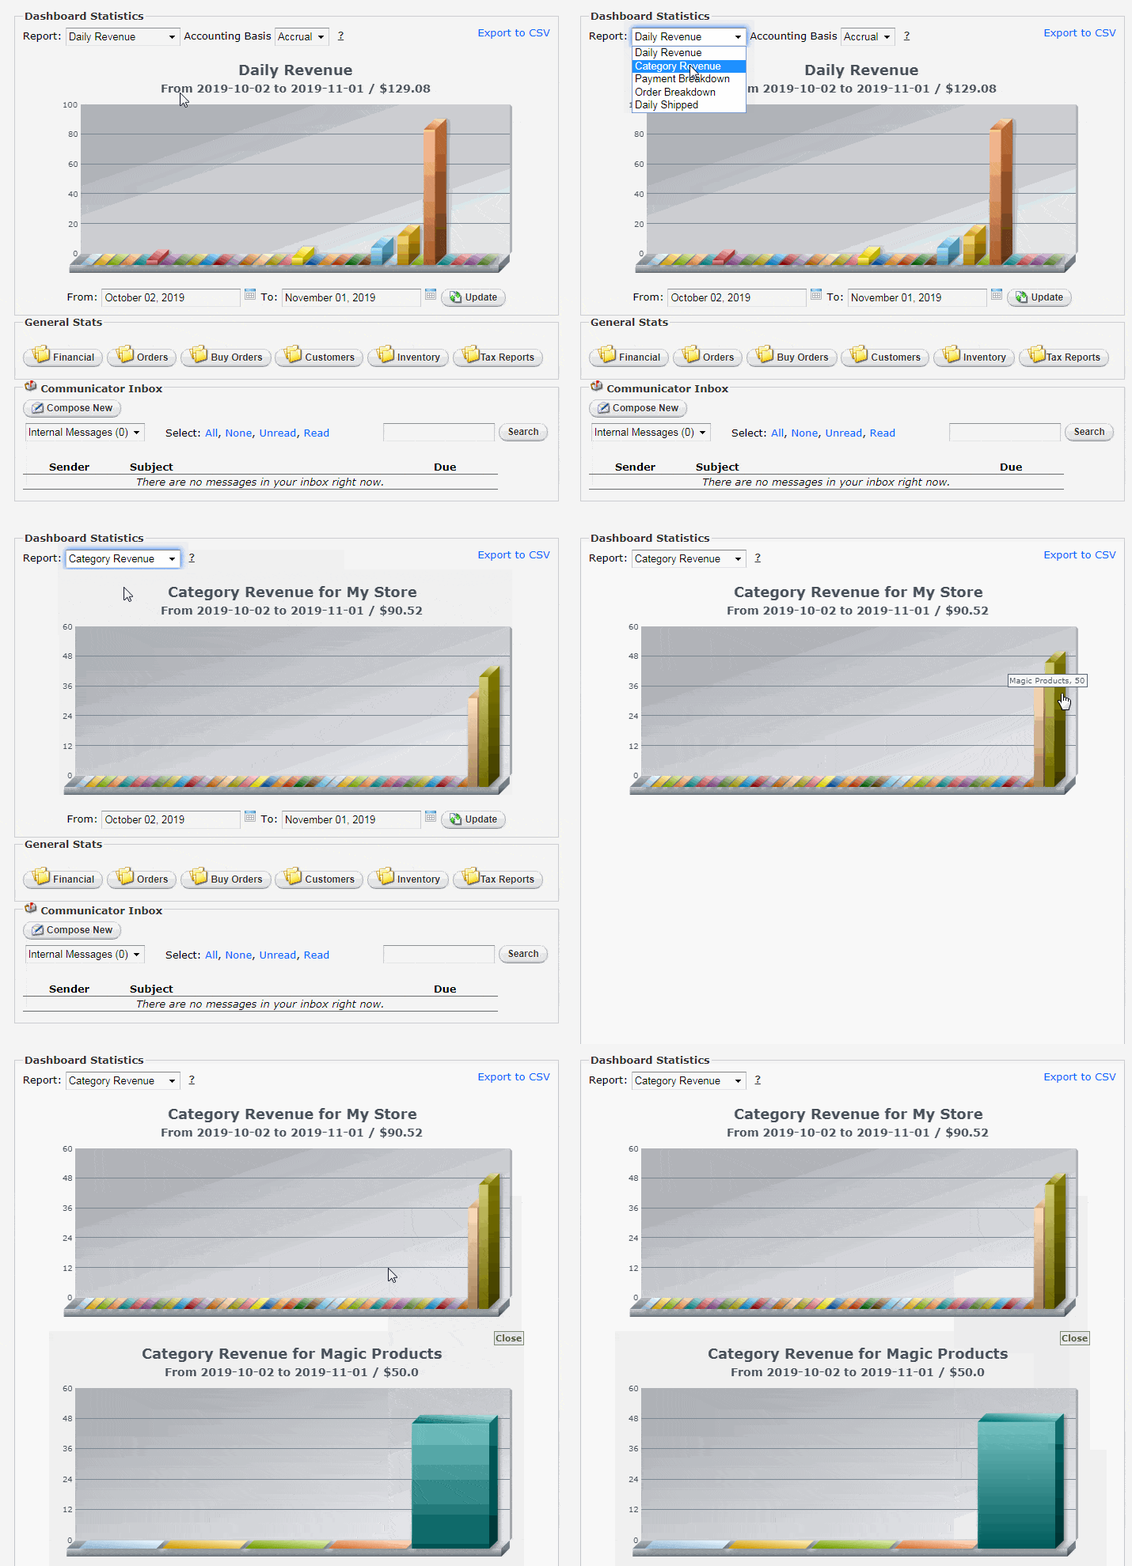
The best way to view category revenue for a certain date range is going to be to use the sales graph on the dashboard. From the dropdown menu above the graph, select the “Category” view. Then, you can set your date range, and click on the bar for the specific category you want to look at. Clicking on it will open a second graph below, with the revenue information of its subcategories.

If you get a blank graph that says “invalid data” when clicking on one of the bars, that can be fixed by enabling flash in your browser. We have a guide for that here: http://help.crystalcommerce.com/faqs-and-troubleshooting/how-to-use-crystalcommerce/fixing-flash


